Dashboard Data
The Internet Monitor dashboard offers a collection of data visualization “widgets” based on primary data collected by the Berkman Klein Center and our partners, as well as relevant secondary data. A full list of widgets within the dashboard is below. To suggest additional data for inclusion in the dashboard, please see our Contact page.
Jump to data from:
Akamai | Change.org | Global Voices | Google | GSMA Intelligence | Herdict | Internet Monitor | ITU | Kaspersky | Lumen | Media Cloud | Tor | Wikipedia | Other Sources
From AkamaiBack to top
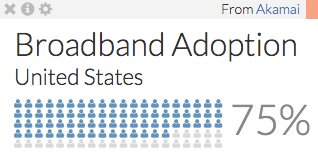
Broadband Adoption
This widget shows the percentage of connections to Akamai from a given country with bandwidth greater than four megabits per second.
More about the data | More from Akamai
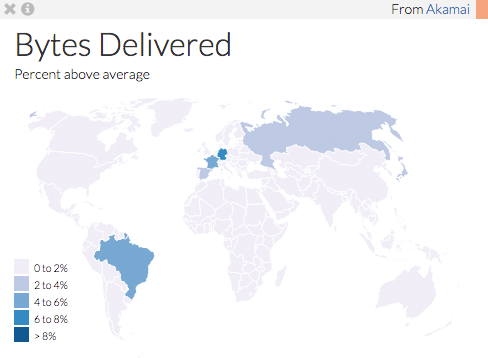
Bytes Delivered
This widget shows the percentage of connections to Akamai from a given country with bandwidth greater than four megabits per second.
More about the data | More from Akamai
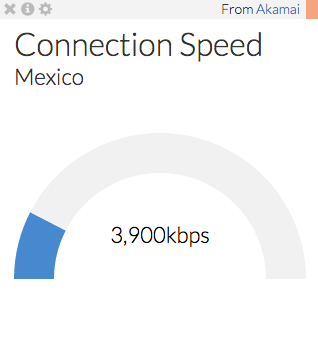
Connection Speed
The connection speed measures how quickly (in kilobits per second) data can be transferred from the Internet to a local computer. The data averages all of the connection speeds calculated over a period of time from the unique IP addresses determined to be in a specific country.
More about the data | More from Akamai
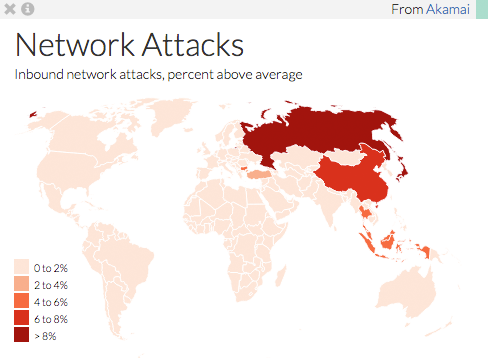
Network Attacks
The shading on the map indicates how far above average the country-level inbound network attacks are for each country.
More about the data | More from Akamai
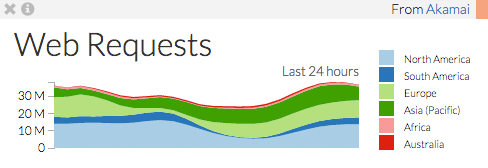
Web Requests
This widget shows the number of HTTP hits (raw requests) per second the Akamai network receives from each continent.
More about the data | More from Akamai
From Change.orgBack to top
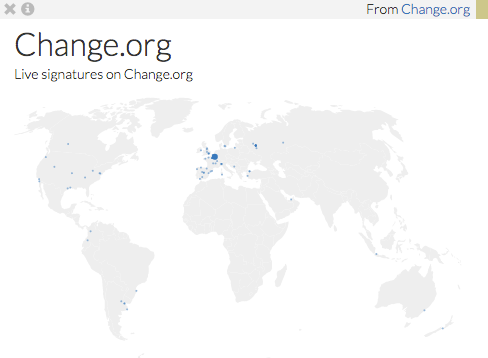
Change.org Impact Map
Change.org helps people start campaigns, mobilize supporters, and work with decision makers to drive solutions around the world. The impact map displays a real-time map of signatures on Change.org petitions.
More about the data | More from Change.org
From Global VoicesBack to top

Recent Global Voices Stories
Global Voices has been leading the conversation on citizen media reporting since 2005. Global Voices curates, verifies, and translates trending news and stories you might be missing on the Internet from blogs, independent press, and social media in 167 countries.
More about the data | More from Global Voices
From GoogleBack to top
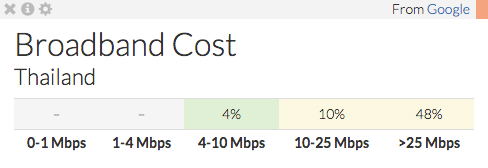
Broadband Cost
Broadband costs are calculated across five tiers based on advertised download speed. Costs are expressed as a proportion of per capita income to produce a rough measure of the ability for households to purchase a broadband connection.
More about the data | More from Google Policy by the Numbers
From GSMA IntelligenceBack to top
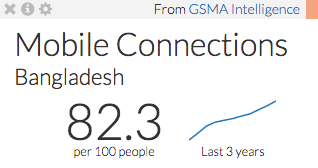
Mobile Connections
This widget displays the number of mobile connections per 100 people in a country, as well as a trendline showing historical data.
More from GSMA Intelligence
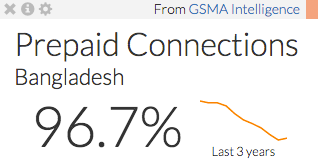
Prepaid Connections
This widget displays the percentage of mobile connections in a country that are prepaid, as well as a trendline showing historical data.
More from GSMA Intelligence
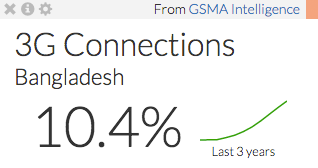
3G Connections
This widget displays the percentage of mobile connections in a country that are 3G, as well as a trendline showing historical data.
More from GSMA Intelligence
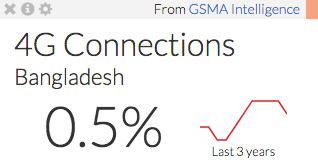
4G Connections
This widget displays the percentage of mobile connections in a country that are 4G, as well as a trendline showing historical data.
More from GSMA Intelligence
From HerdictBack to top
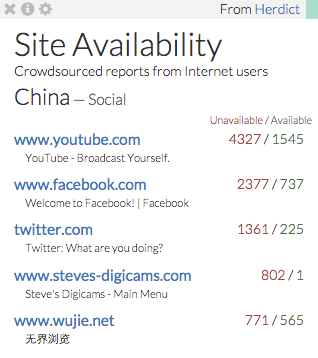
Crowdsourced Website Availability
Herdict is a user-driven platform for identifying web blockages—including denial of service attacks, censorship, and other filtering—as they happen. Users can report whether specific sites are available or unavailable in their country. This widget shows Herdict data for each country and content category over all time. For more information, see Herdict's About and FAQ pages.
More about the data | More from Herdict
From Internet MonitorBack to top
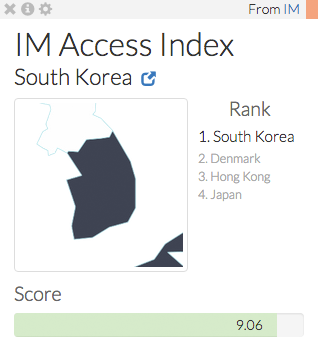
Internet Monitor Access Index
The Internet Monitor Access Index captures Internet access from several angles. Each country's rank and score is calculated based on Internet adoption, speed, price, and proxies for the ability of citizens to productively engage in online activity if given the opportunity: gender equality and education. For more information on the Access Index, see "A Hackable Access Index." To configure your own index, visit the access map.
More about the data | More from Internet Monitor
From the International Telecommunication UnionBack to top
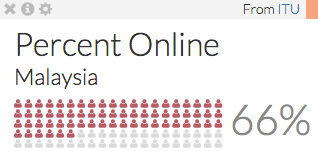
Percent Online
The widget shows the percent of a country's population using the Internet regularly. The data, generally based on surveys, includes users who have accessed the Internet over the last twelve months.
More about the data | More from the ITU
From KasperskyBack to top
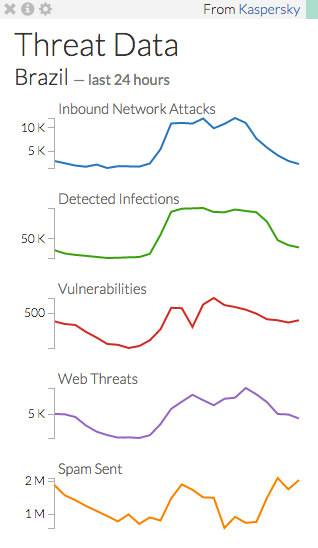
Threat Data
Kaspersky collects data on cyberthreats from its customers worldwide. This widget shows the number of inbound network attacks, detected infections, vulnerabilities, web threats, and spam messages sent in each country over the past 24 hours. For more detailed information, see Kaspersky's data sources page.
More about the data | More from Kaspersky
From LumenBack to top
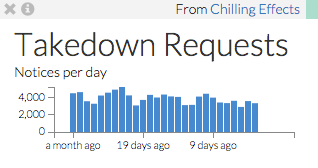
Takedown Requests
The Lumen database collects and analyzes legal complaints and requests for removal of online materials, helping Internet users to know their rights and understand the law. This widget shows the number of requests for removal of online materials Lumen has received over the past month.
More from Lumen
From Media CloudBack to top

Media Monitor
Media Cloud collects and analyzes the news stream of tens of thousands of online sources. This widget shows a list of recent articles from a selected country that include a selected term.
More from Media Cloud

News Topics
Media Cloud collects and analyzes the news stream of tens of thousands of online sources. The word cloud is based on words that appear frequently in online media in a given language over the past week.
More from Media Cloud
From TorBack to top
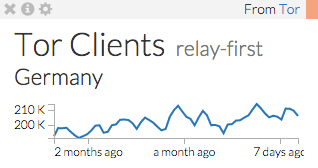
Tor Clients
Tor clients connect to many intermediate nodes before connecting to the intended destination, but there are two types of nodes the client can connect to first:
- relay: a publicly-listed node in the Tor network that forwards traffic on behalf of clients, and that registers itself with the directory authorities
- bridge: a relay whose existence is non-public and which can therefore provide access for blocked clients
This widget displays the approximate daily number of connections to each of these first-node types for a specific country over the last 60 days.
More about the data | More from Tor
From WikipediaBack to top
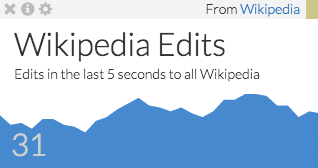
Wikipedia Edit Volume
This widget displays a streaming graph of the number of edits to a given language's Wikipedia over time. The language and time frame can be adjusted in the widget's settings.
More about the data | More from Wikipedia
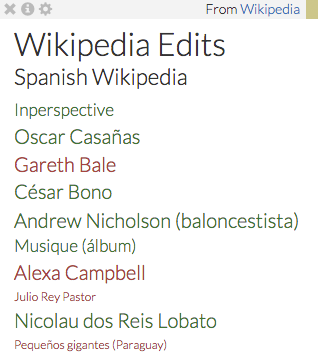
Wikipedia Edits
This widget displays a streaming list of edits to a given language's Wikipedia. The size of the page title corresponds to the size of the edit. Additions are in green; deletions are in red.
More about the data | More from Wikipedia
Other SourcesBack to top
The dashboard includes several widgets that allow users to embed their own content and track additional RSS feeds. These can be used to add images, text, interactive charts, video, embedded documents, news and blog posts from other websites, and more.
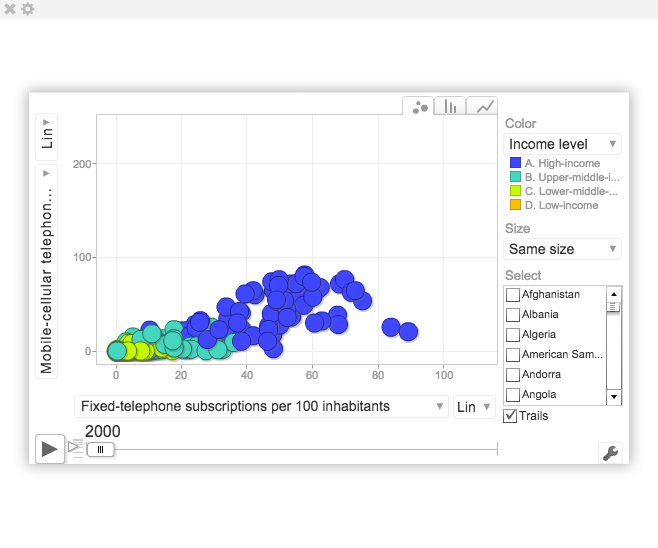
Embed
This widget can be used to embed charts, maps, videos, documents, and more from other online sources. To use this widget, copy and paste the desired iframe code into the widget's settings.

Feed
This widget can be used to display recent items from an RSS or Atom web feed. Use it to track news, blog posts, podcast episodes, and more. To use this widget, copy and paste the desired feed into the widget's settings.
Your Content
This widget allows you to include your own images and text. It can be used to label sections within your dashboard or to display images or notes.
Questions? See our FAQ.
Interested in the data in our data platform? Check out our Platform Data page or download it directly.
(last updated July 1, 2014)
Curious about the Internet Monitor Access Index? A Hackable Access Index explains.