FAQ
Welcome to the Internet Monitor FAQ!
What are you looking for today?
- Basic information about the Internet Monitor project
- Information about the Internet Monitor dashboard
- Information about the Internet Monitor platform
- What's the difference between the dashboard and the platform?
General Internet Monitor FAQBack to top
What data does Internet Monitor have?Back to top
We’re so glad you asked! Internet Monitor collects data on Internet access & infrastructure, online content controls, and digital activity. You can also check out the full lists of data in our Access Index and platform and our data dashboard.
What are “access,” “activity,” and “control”?Back to top
We categorize data about the Internet into three broad buckets. The first is access, which includes metrics that describe both the physical architecture and operation of the Internet and the ability of individual users to gain physical access to the Internet. The second is control, which looks at how content is regulated (blocked, taken down, hacked) online. The third is activity, which covers the ways in which humans create, consume, and share information online, as well as relationships and communities that are formed. For more, see our paper, "Measuring Internet Activity: A (Selective) Review of Methods and Metrics."
What’s the difference between the platform/Access Index and the dashboard?Back to top
The platform and Access Index offer access to a set of 15 indicators about Internet access and infrastructure, which offer a starting point for further analysis of Internet access conditions in 92 countries. The dashboard offers users the opportunity to customize a collection of data visualization “widgets” according to their interests. The dashboard compiles and curates data from multiple sources, including primary data collected by the Berkman Klein Center and our partners, as well as relevant secondary data. For more, see our About page.
Dashboard FAQBack to top
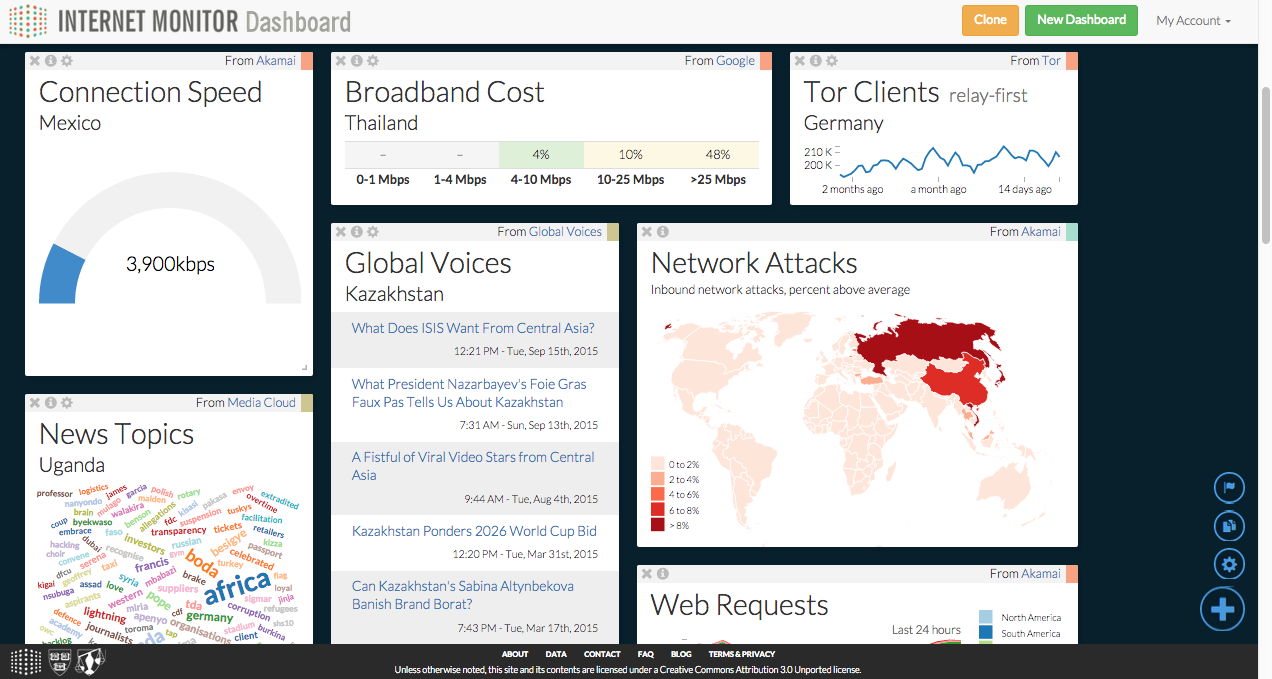 The Internet Monitor dashboard helps researchers, advocates, policymakers, and user communities understand trends in Internet health and activity through research, analysis, and data visualization. The dashboard lets users create collections of data visualization widgets—known as "boards"—that provide a real-time view of the state of the Internet across a variety of dimensions, enable easy comparisons across countries and data sources, and are easy to configure, edit, and share.
Questions about the dashboard? We recommend starting with the tutorial:
How do I create a board?Back to Dashboard FAQ
You can create a dashboard anonymously—in which case anyone with the link can view and edit your dashboard, and your dashboard won't show up in any listings (so you should save the link)—or after signing in, which lets you track all of the dashboards you create and decide whether you want other people to be able to edit them.
To create a dashboard, visit the dashboard home page and click the “Get Started” button, or click on the “New Dashboard” button at the top of any existing dashboard.
How do I create a user account?Back to Dashboard FAQ
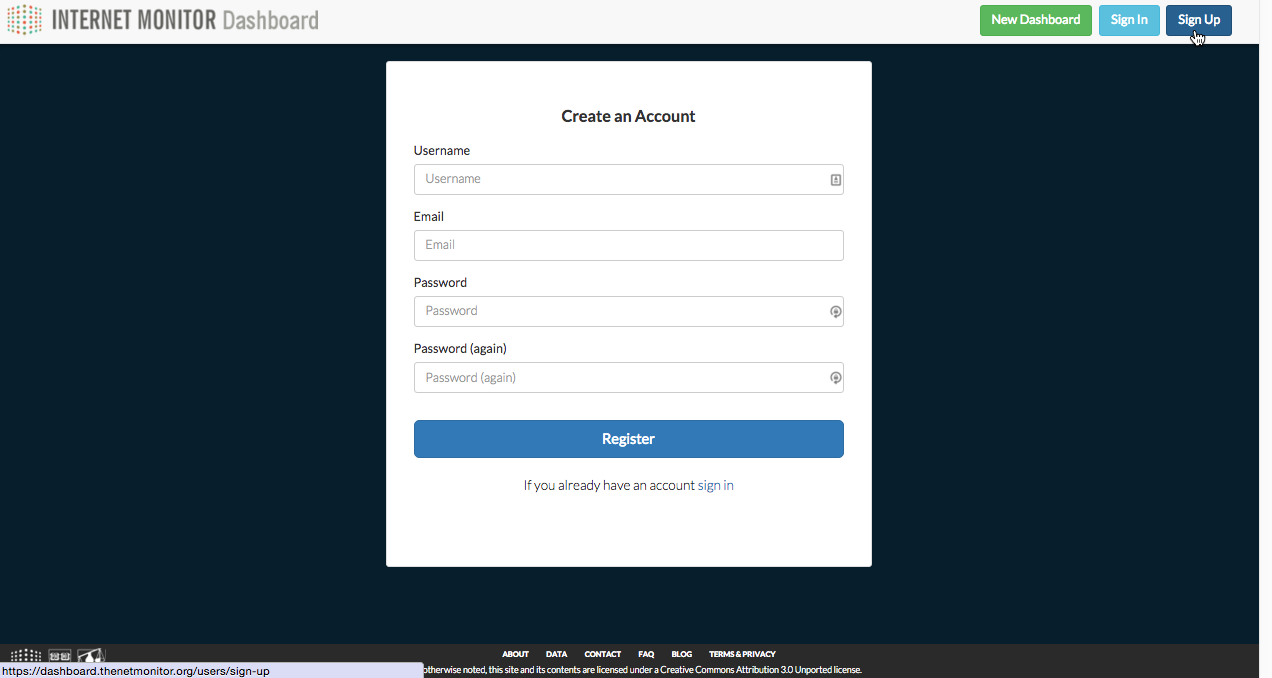
User accounts let you save your dashboards and decide whether you want other people to be able to edit them. To create an account, click the blue “Sign Up” button and follow the prompts.
How can I change who can edit my dashboard?Back to Dashboard FAQ
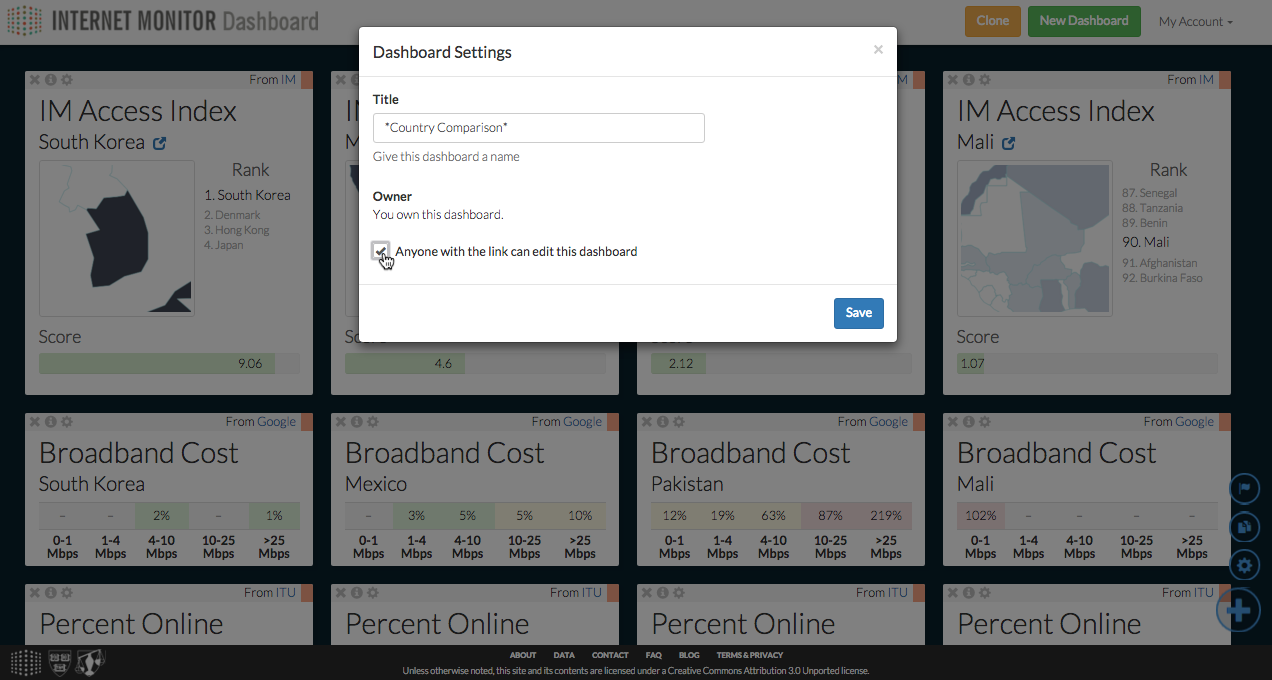
Sometimes, you may want to collaborate with others and allow them to add or remove widgets, rearrange things, or change settings. Other times, you may want to prevent others from making changes to the dashboards you create. If you create a dashboard while signed in, you can decide whether to let others to edit your dashboard. When viewing a dashboard you’ve created, click on the blue settings icon (![]() ) in the bottom right corner to open the settings window. In that window, you can choose whether to check the “Anyone with the link can edit this dashboard” setting.
) in the bottom right corner to open the settings window. In that window, you can choose whether to check the “Anyone with the link can edit this dashboard” setting.
What is an anonymous dashboard?Back to Dashboard FAQ
Anonymous dashboards are created by users who are not logged in. Anonymous dashboards can be edited by anyone. Anonymous dashboards don’t show up in any listings, so if you want to return to one later, you should save the link.
How do I add new widgets to my dashboard?Back to Dashboard FAQ
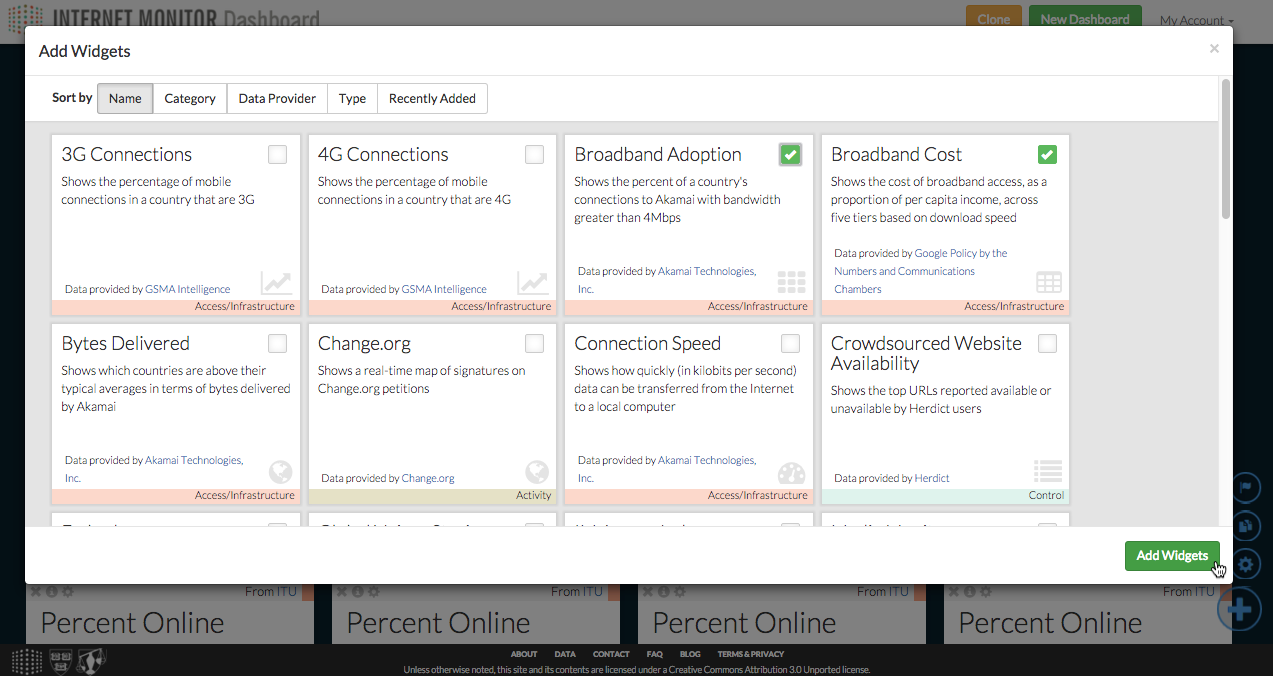
Click on the plus icon (![]() ) in the bottom right corner to bring up the “Add Widgets” menu. From there, you can select multiple widgets to add.
) in the bottom right corner to bring up the “Add Widgets” menu. From there, you can select multiple widgets to add.
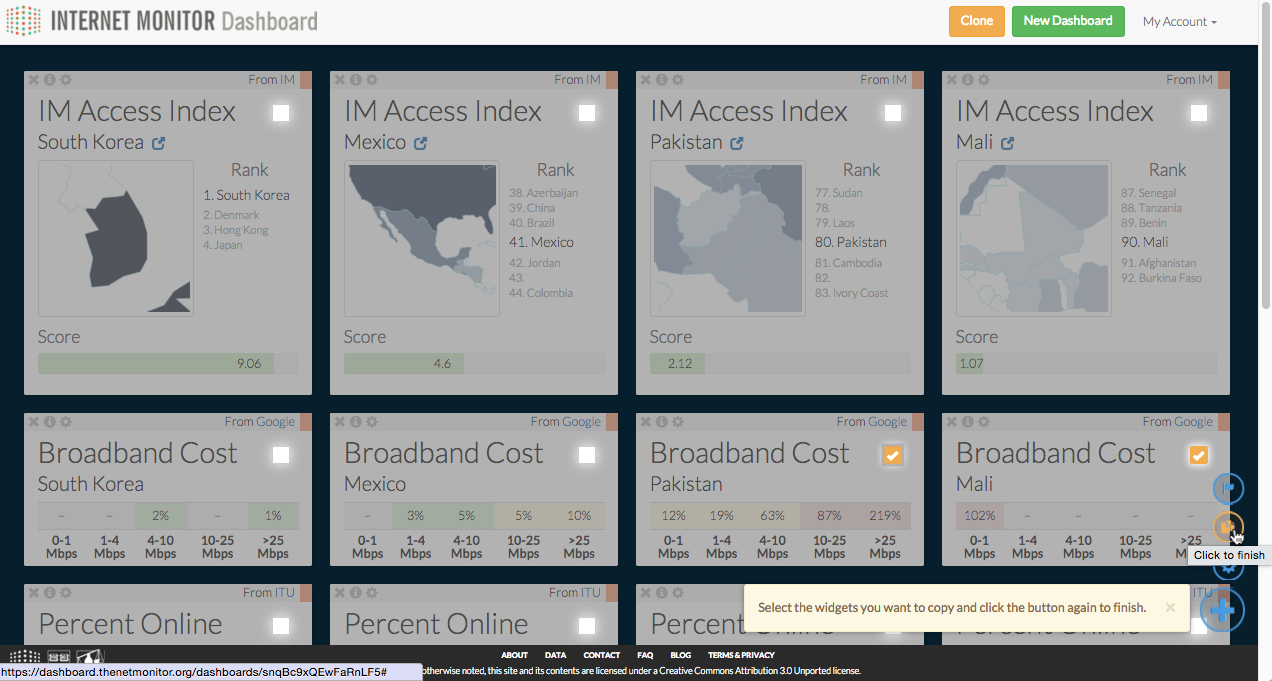
If you already have widgets in your dashboard and would like to add another copy of them to the same dashboard, you can click the copy icon (![]() ) in the bottom right, select the widgets you’d like to copy, and click the icon again. This will duplicate the selected widgets within the dashboard.
) in the bottom right, select the widgets you’d like to copy, and click the icon again. This will duplicate the selected widgets within the dashboard.
How do I remove widgets from my dashboard?Back to Dashboard FAQ
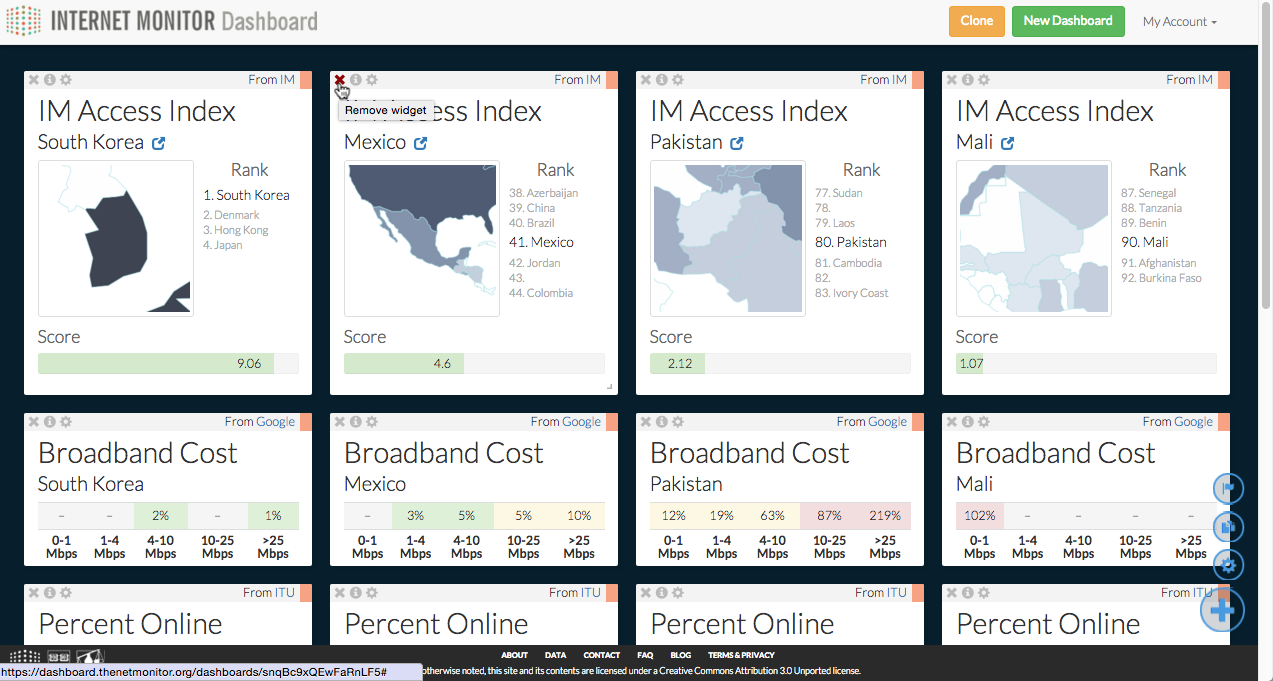
Click the "x" in the top left corner of a widget to remove it from a dashboard.
How do I move widgets around within my dashboard?Back to Dashboard FAQ
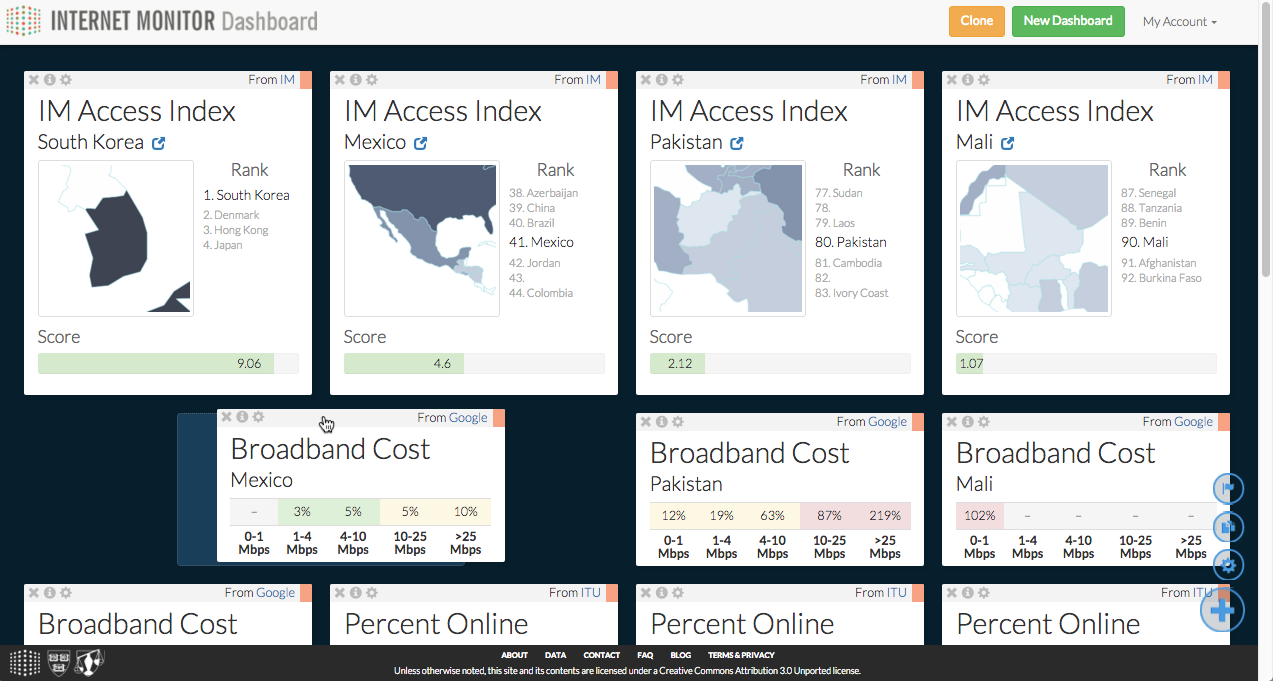
Click and hold on a widget's title bar, then drag it around. Let go when you're ready to drop the widget into place.
How do I find out more about the data in a widget?Back to Dashboard FAQ
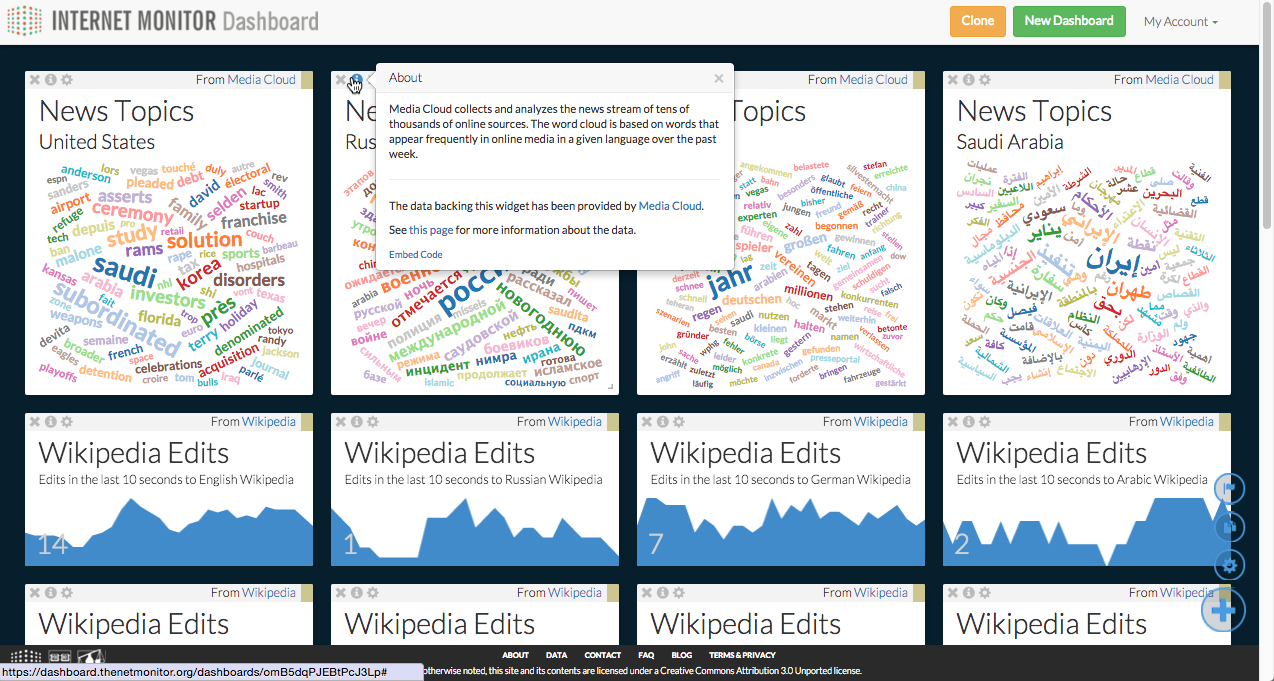
Click on the info icon (![]() ) in a widget's top left corner to learn more about the data in the widget and the organization providing the data. You can also click through to the original data source.
) in a widget's top left corner to learn more about the data in the widget and the organization providing the data. You can also click through to the original data source.
The "Add a Widget" menu also contains details about each widget in the dashboard. You can sort this menu by name, widget category (Internet Access & Infrastructure, Online Activity, and Online Content Controls), data provider, data visualization type, and how recently widgets were added.
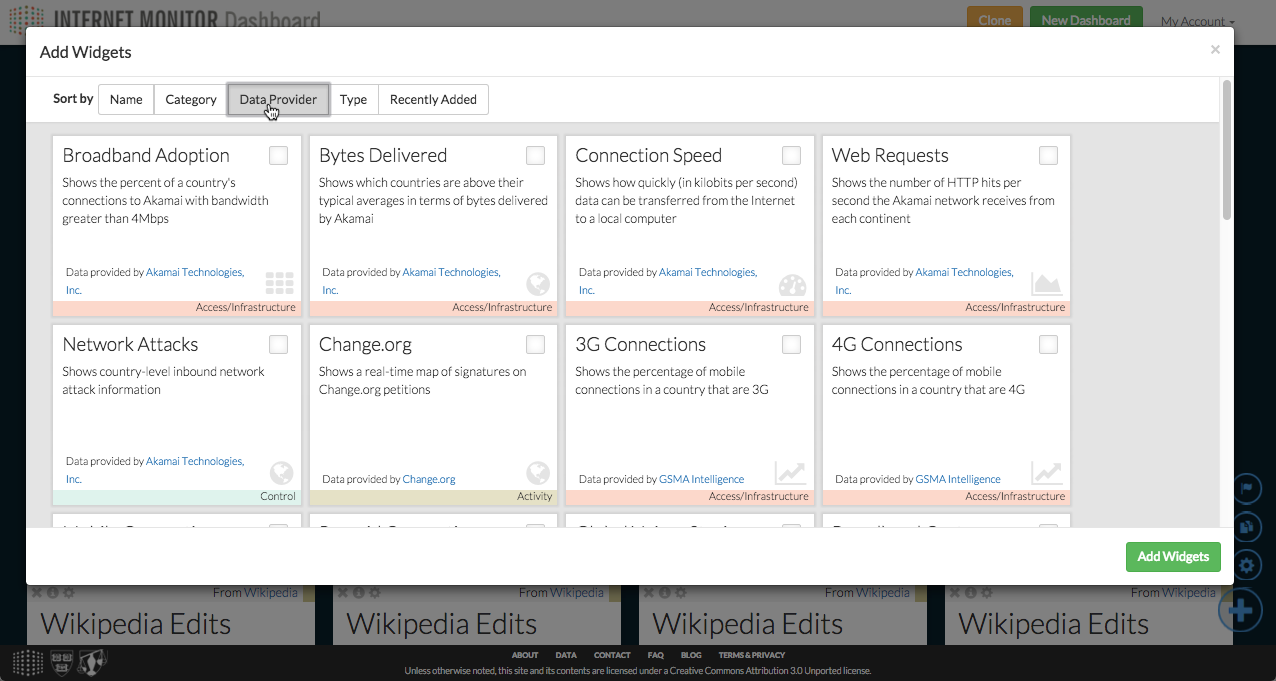
For a full list of widgets and data sources, you can also visit the dashboard data sources page.
How do I embed a widget in another website?Back to Dashboard FAQ
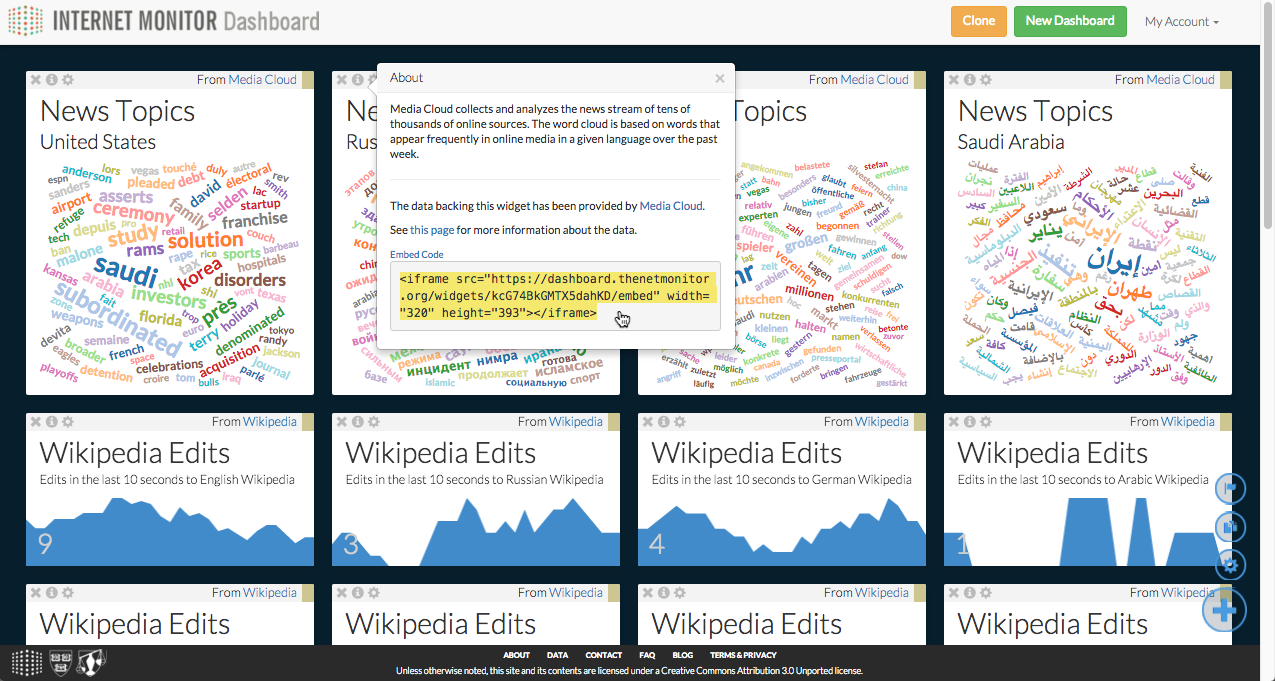
Click on the info icon (![]() ) in a widget's top left corner to open up the info window. At the bottom of that window, there's an "Embed Code" link. Click the link, copy the embed code, and paste it into your website. Note that widget embedding will only work on websites that accept iframe embeds.
) in a widget's top left corner to open up the info window. At the bottom of that window, there's an "Embed Code" link. Click the link, copy the embed code, and paste it into your website. Note that widget embedding will only work on websites that accept iframe embeds.
Can I create a copy of a dashboard?Back to Dashboard FAQ
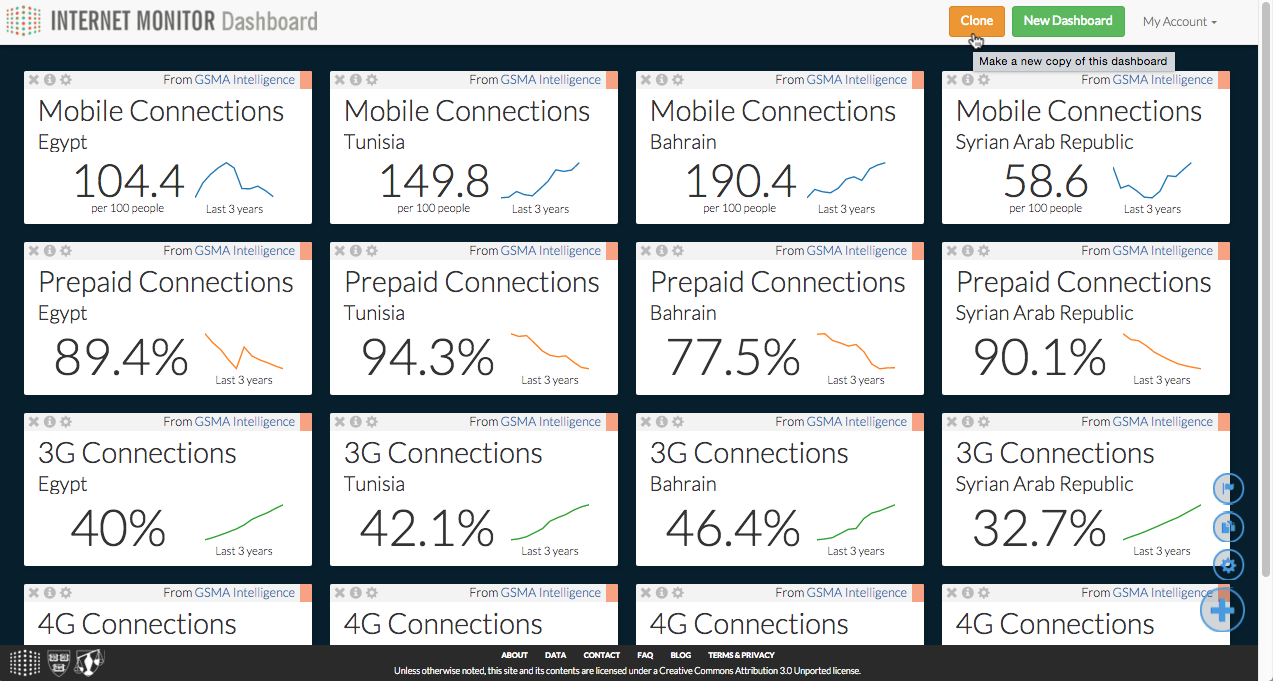
See a dashboard you like? You can make a copy of any dashboard by clicking the “Clone” button at the top of the screen.
How do I change a widget’s settings?Back to Dashboard FAQ
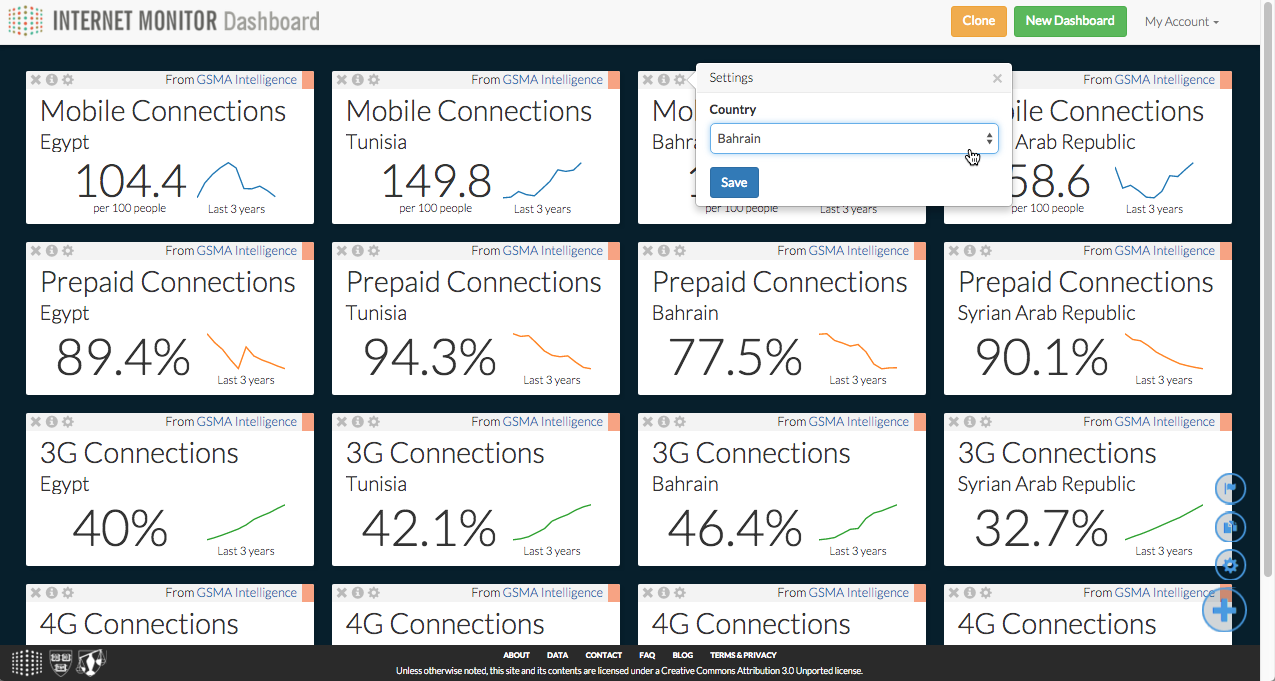
Each widget that has multiple settings has a gray settings icon (![]() ) in its upper left corner. Click on that icon to bring up the settings dialog. From there, depending on the widget, you can change the country and/or edit the widget’s content.
) in its upper left corner. Click on that icon to bring up the settings dialog. From there, depending on the widget, you can change the country and/or edit the widget’s content.
Can I change multiple widgets’ settings at once?Back to Dashboard FAQ
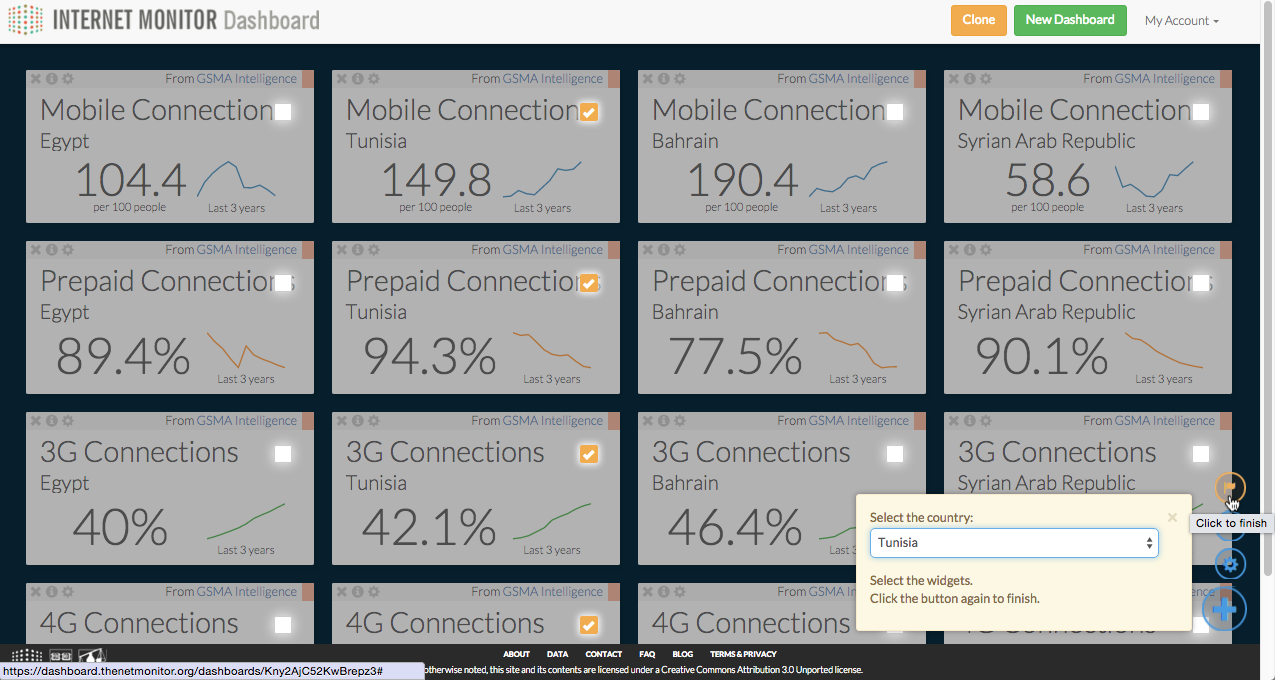
To change multiple widgets’ settings at once—for example, to set a group of widgets to a specific country—click on the flag icon (![]() ) in the bottom right. Select the widgets you’d like to edit, choose the desired country, and click the flag icon again. This will change all of the selected widget’s settings to that country.
) in the bottom right. Select the widgets you’d like to edit, choose the desired country, and click the flag icon again. This will change all of the selected widget’s settings to that country.
Can I duplicate widgets within a dashboard?Back to Dashboard FAQ
If you already have widgets in your dashboard and would like to add another copy of them to the same dashboard, you can click the copy icon (![]() ) in the bottom right, select the widgets you’d like to copy, and click the icon again. This will duplicate the selected widgets within the dashboard.
) in the bottom right, select the widgets you’d like to copy, and click the icon again. This will duplicate the selected widgets within the dashboard.

How can I contribute new data to the dashboard?Back to Dashboard FAQ
Have a dataset you’d like to contribute to the dashboard, or an idea for a dataset we should include? Fantastic! We’re actively seeking new data partners, and we’d love to hear from you. Check out our Contact page to get in touch.
How can I contribute a new widget to the dashboard?Back to Dashboard FAQ
 Have an idea for a new widget? We can’t wait to see it. The dashboard code is hosted on GitHub under an MIT license, and we welcome contributions. Check out our documentation to get started.
Have an idea, but not sure how to build it? You can either submit an issue through GitHub or reach out via our Contact page.
Platform and Access Index FAQBack to top
What is the Internet Monitor country score?Back to Platform FAQ
Internet Monitor's Access Index aggregates 15 indicators to provide a rough single estimate of the quality of Internet access in countries for which we have collected enough data. We include measures of adoption, speed and quality, and cost, along with several indicators measuring literacy and education rates that attempt to round out the context of the score with additional information. A full explanation of how we collect, aggregate, and analyze this data is available here: A Hackable Access Index.
Indicators within the Internet Monitor Access index are collected into four groups. In order to receive a score, countries must have data for at least one indicator in each group. For definitions of these indicators, more information about their sources, and to download data, please see our Data page.
Adoption
- Percentage of individuals using the Internet
- Percentage of households with Internet
- Wired Internet subscription rate
- Active mobile broadband subscription rate
Speed & Quality
- Broadband adoption rate
- High broadband adoption rate
- Average connection speed (kbps)
- Average peak connection speed (kbps)
- Average download speed (kbps)
- Average upload speed (kbps)
- R-factor
Price
- Broadband monthly subscription charge (in USD PPP) as a percentage of monthly GDP per capita
Education (Literacy & Gender Equality)
- Literacy rate
- Population with at least a secondary education, female
- Population with at least a secondary education, male
How can I create my own score?Back to Platform FAQ
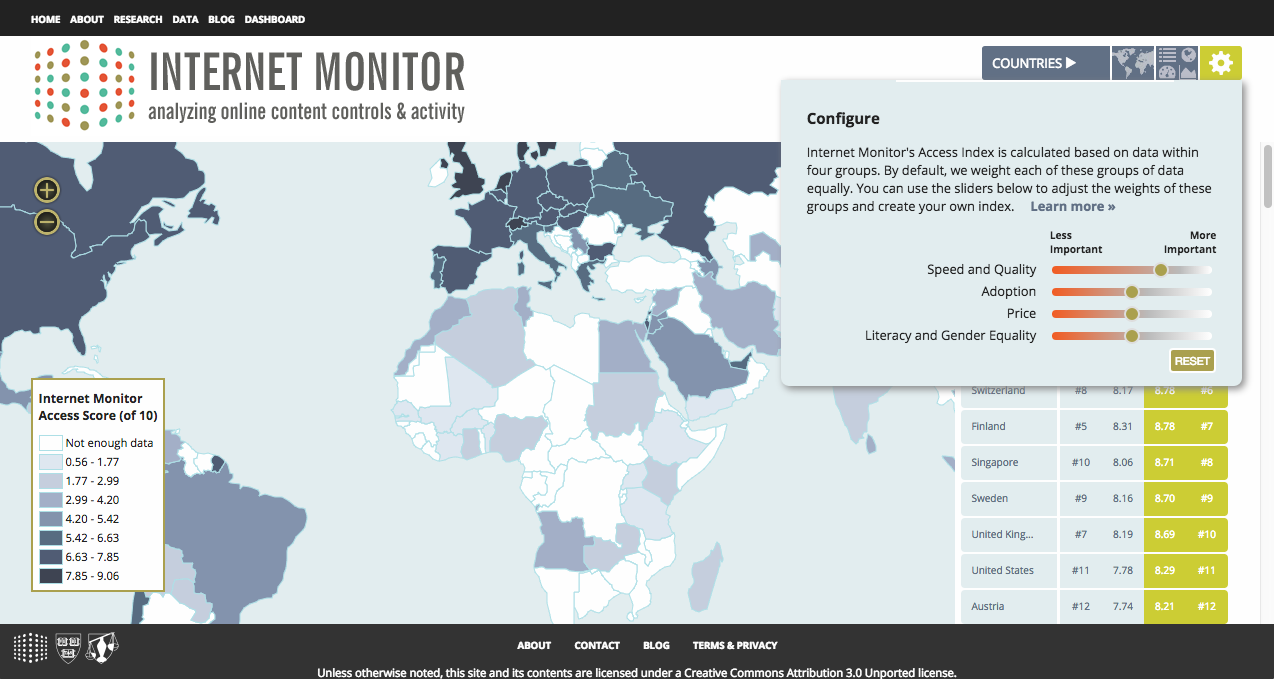
We encourage you to create your own Access Index scores based on the indicator groups you feel are most important. To create your own score, simply click the settings icon at the top of the screen or the green score next to any country name to adjust the weights of the indicator groups and calculate your own values. Your values for each country are displayed in green next to the Internet Monitor score.
Why aren't the original values displayed for all indicators in the platform?Back to Platform FAQ
The data we are using on active mobile broadband subscription rates comes from the 2013 edition of the ITU World Telecommunication/ICT Indicators database. The ITU's policies on use of information in this database prevent us from placing this database on an external website. We are actively seeking an alternate source of mobile broadband subscription data. In the meantime, mobile broadband subscription data from 2010 can be found in the country tables appendix of "Maximizing Mobile," a 2012 report published by the World Bank.